
 Athyna Moore, Director of Sales Enablement
Automotive Digital Marketing Solutions: Digital Advertising and SEO
Long before they reach your lot, shoppers are seeing your inventory in ads and searching for answers online. This guide shows how digital...
When you're trying to take your dealership to the next level, you inevitably look at your marketing ask yourself: What is all this marketing spend driving?
If your reports stop at activity metrics, the best answer you've got is, "We got a lot of traffic." A better answer starts with knowing how to measure performance yourself.
Dealerships measure marketing performance by connecting three things: What you spent, what sold, and how that compares to your market. Automotive marketing analytics is the reporting layer that ties them together, so you can see which campaigns sold cars instead of which ones looked busy.
To measure what your marketing is really doing, start with these three questions.
Start at the outcome. Your clearest number is cost per unit sold, which is the total ad dollars it took to sell one vehicle. Then track how many of your advertised vehicles sold and how fast they moved. Together, these are the metrics that predict whether a car sells:
Selling 60 units can feel like a good month until you learn the market moved 80. Measure yourself against the dealers competing for the same buyers, using real-time market data:
Keep an eye on the automotive marketing analytics that warn you when a vehicle is at risk of aging on your lot, so you can adjust your ad spend before it becomes a problem. These analytics include:
.png?width=800&height=800&name=CIQ%20VINScore%20(1).png)
Activity reporting measures how your automotive digital advertising campaigns performed. Outcome reporting measures what your advertising produced. You need both, but only one tells you if you sold a car.
Here's the difference:
| Activity Metrics | Outcome Metrics |
| Impressions | Sold VINs |
| Clicks and CTR | Cost per unit sold |
| Cost per click | Days to move |
| Ad reach | Turn rate and market share |
Activity metrics tell you a campaign is live and reaching shoppers, and they help you catch problems early. But a busy campaign and a campaign that sells cars aren't always the same thing.
That's where outcomes come in. When your reports connect a sold VIN back to the ad that influenced it, you can prove the spend did its job.
Linwood GMC's social media advertising generated a 5.5% click-through rate, about 5x the 1% automotive Facebook benchmark. Strong activity, yes. The number that mattered was the 169 vehicles those ads moved.
Marketing attribution connects a sale to the marketing that drove it. This attribution only works when you can see the source that first brought the opportunity through your door.
Here's a path shoppers take every day. A buyer clicks a search ad, browses your inventory, runs a trade-in estimate, then submits a lead form. Many systems credit the trade-in tool, because that's where the form lives, and they don’t see that a search ad started the opportunity.
Here's how to tie results to what actually drove the sale:
Get this right and your budget follows your best channels on its own, because the attribution reflects how buyers move from first view to signed deal.
The most trustworthy tools share one trait: They tie your ad spend to the vehicles that sold and prove it. If a report can't show you which vehicle sold and what influenced it, it can’t tell you what’s working.
Strong auto dealer analytics give you three things:
This is where Catalyst IQ supports real lead attribution. MarketAI®, our real-time automotive intelligence engine, refreshes your key performance numbers against your market daily and reports at the VIN level, so you see so you see what's moving in your market and how you stack up against nearby dealers.
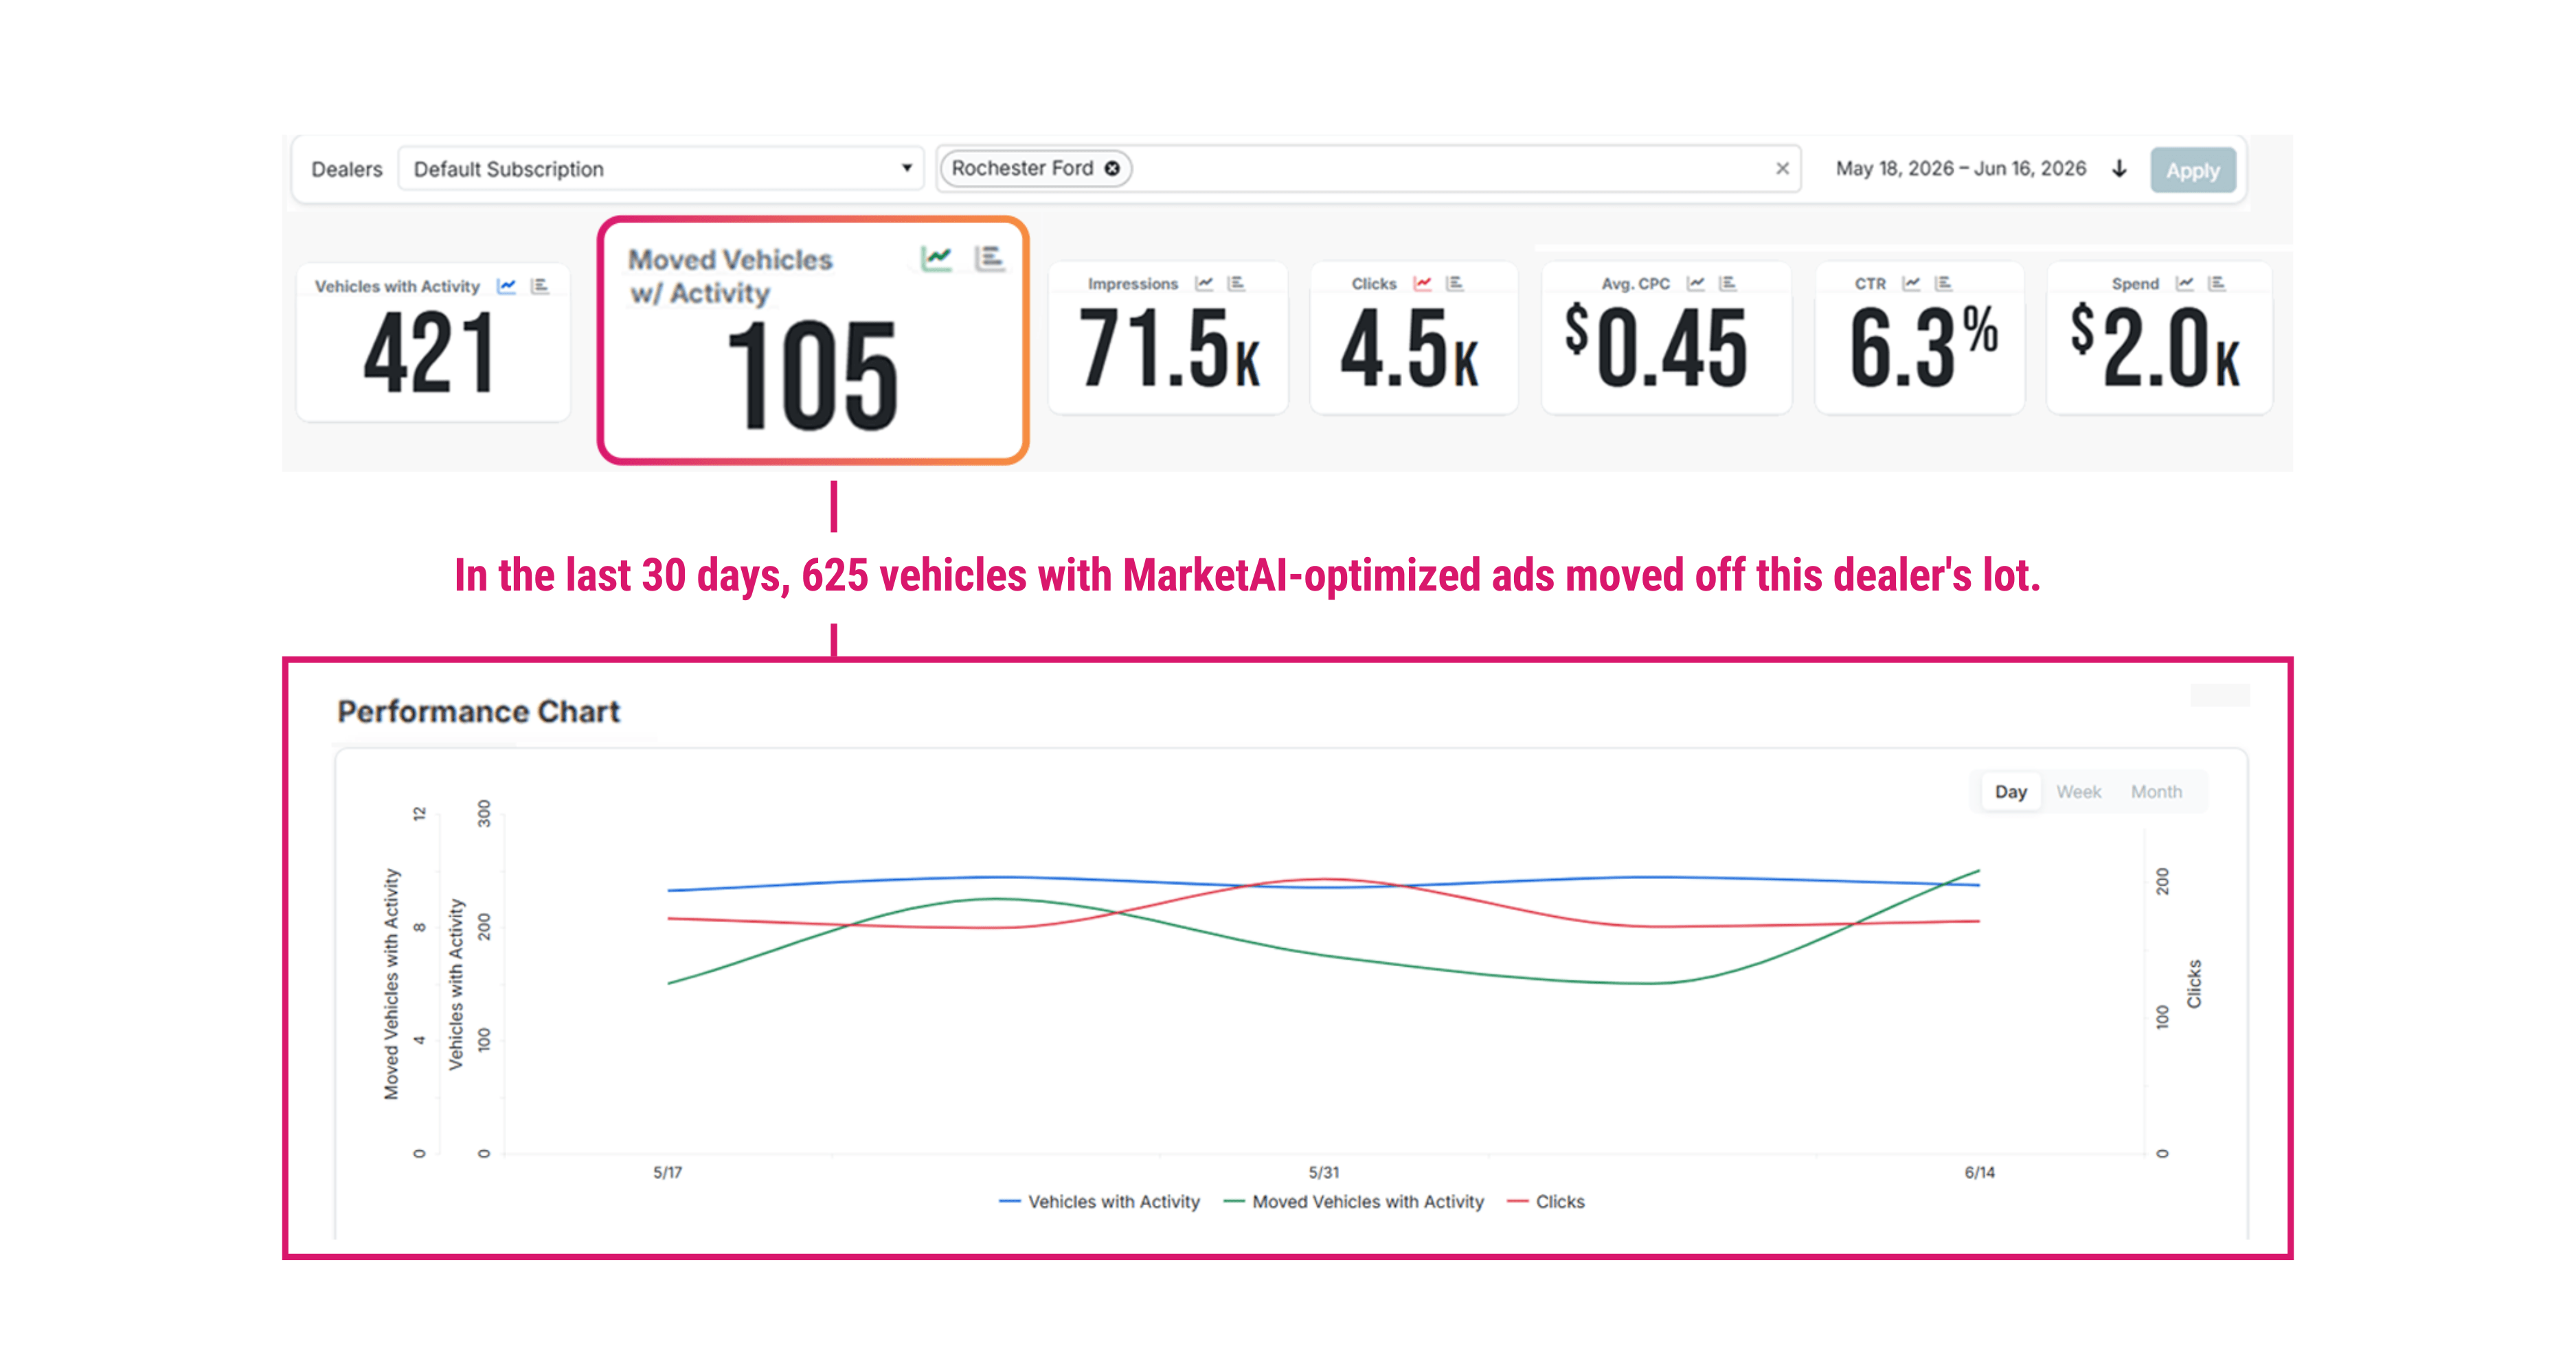
Here's how that tracking works:
Alongside impressions, clicks, and cost per click, MarketAI shows Moved Vehicles with Activity, which are the advertised units that left your lot. That's the number that proves the spend did its job.
For each model, MarketAI sets your price next to the market price and shows how it's selling, so you can tell when a slow unit needs a price change instead of more ad spend.
.png?width=1200&height=628&name=MAI%20Model%20Insights%20(1).png)
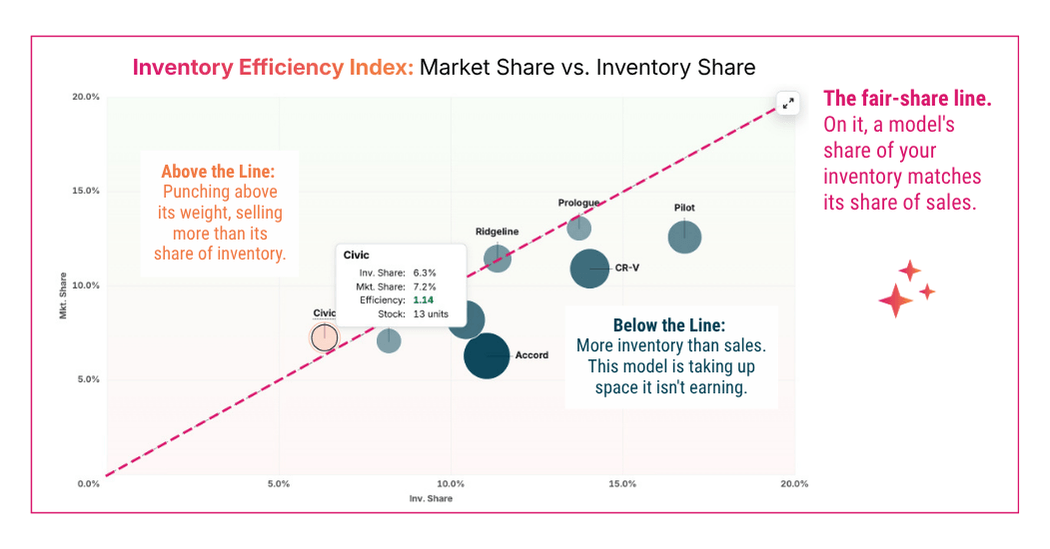
Market Share vs. Inventory Share shows which models sell more than their share of your lot and which take up space they aren't earning.
Catalyst IQ also pairs you with a dedicated Dealer Success Manager (DSM) who reads all of the automotive marketing data for you, flags the opportunities, and tells you what to do next. That pairing of technology and human IQ turns a full-service automotive marketing agency into a partner you can trust and hold accountable.
Dealers deserve clear, accurate automotive marketing data that ties every dollar to a sold VIN, measured against their market in real time, with a Dealer Success Manager ready to act the moment it shifts. Done right, marketing for dealerships stops chasing activity and starts moving inventory.
Request a MarketAI demo to see real-time inventory, turn rate, and competitive data for your market.

Accurate reports tie back to sold VINs, not just clicks and form fills. Trustworthy automotive marketing analytics show you which vehicles sold and what influenced each sale. If a vendor only shows activity, ask how they connect spend to sales.
VIN-level attribution assigns marketing credit at the individual vehicle level, tracking a shopper from first vehicle view to the sale of that specific VIN. It's the most precise way to see which campaigns move which cars. Learn more about how analytics connect ad spend to inventory movement.
Check outcome metrics like sold VINs and turn rate weekly, and run a deeper strategic review monthly. The market shifts fast, so a monthly-only cadence means you're acting on last month's information.
Ask three questions. Can you show me sold VINs tied to campaigns? Can I see my performance against my local market? Where are my blind spots? The answers tell you whether you're buying accountability or activity. A strong automotive digital marketing agency answers all three without hesitating.

About Catalyst IQ
Catalyst IQ is an integrated automotive marketing agency that helps dealerships make smarter decisions and sell more cars using real-time data, AI-powered insights, and expert human support. From digital advertising and web presence to SEO/AEO and engagement, every solution drives measurable growth.

Long before they reach your lot, shoppers are seeing your inventory in ads and searching for answers online. This guide shows how digital...

Model Year Changeover season is here. And for dealers, waiting to support 2026s could come with a significant price tag. We are officially...

No one can tell you what your dealership's marketing will cost before looking at your market. What you spend depends on your local competition,...